Making Buffalo Urban Food System Networks Visible
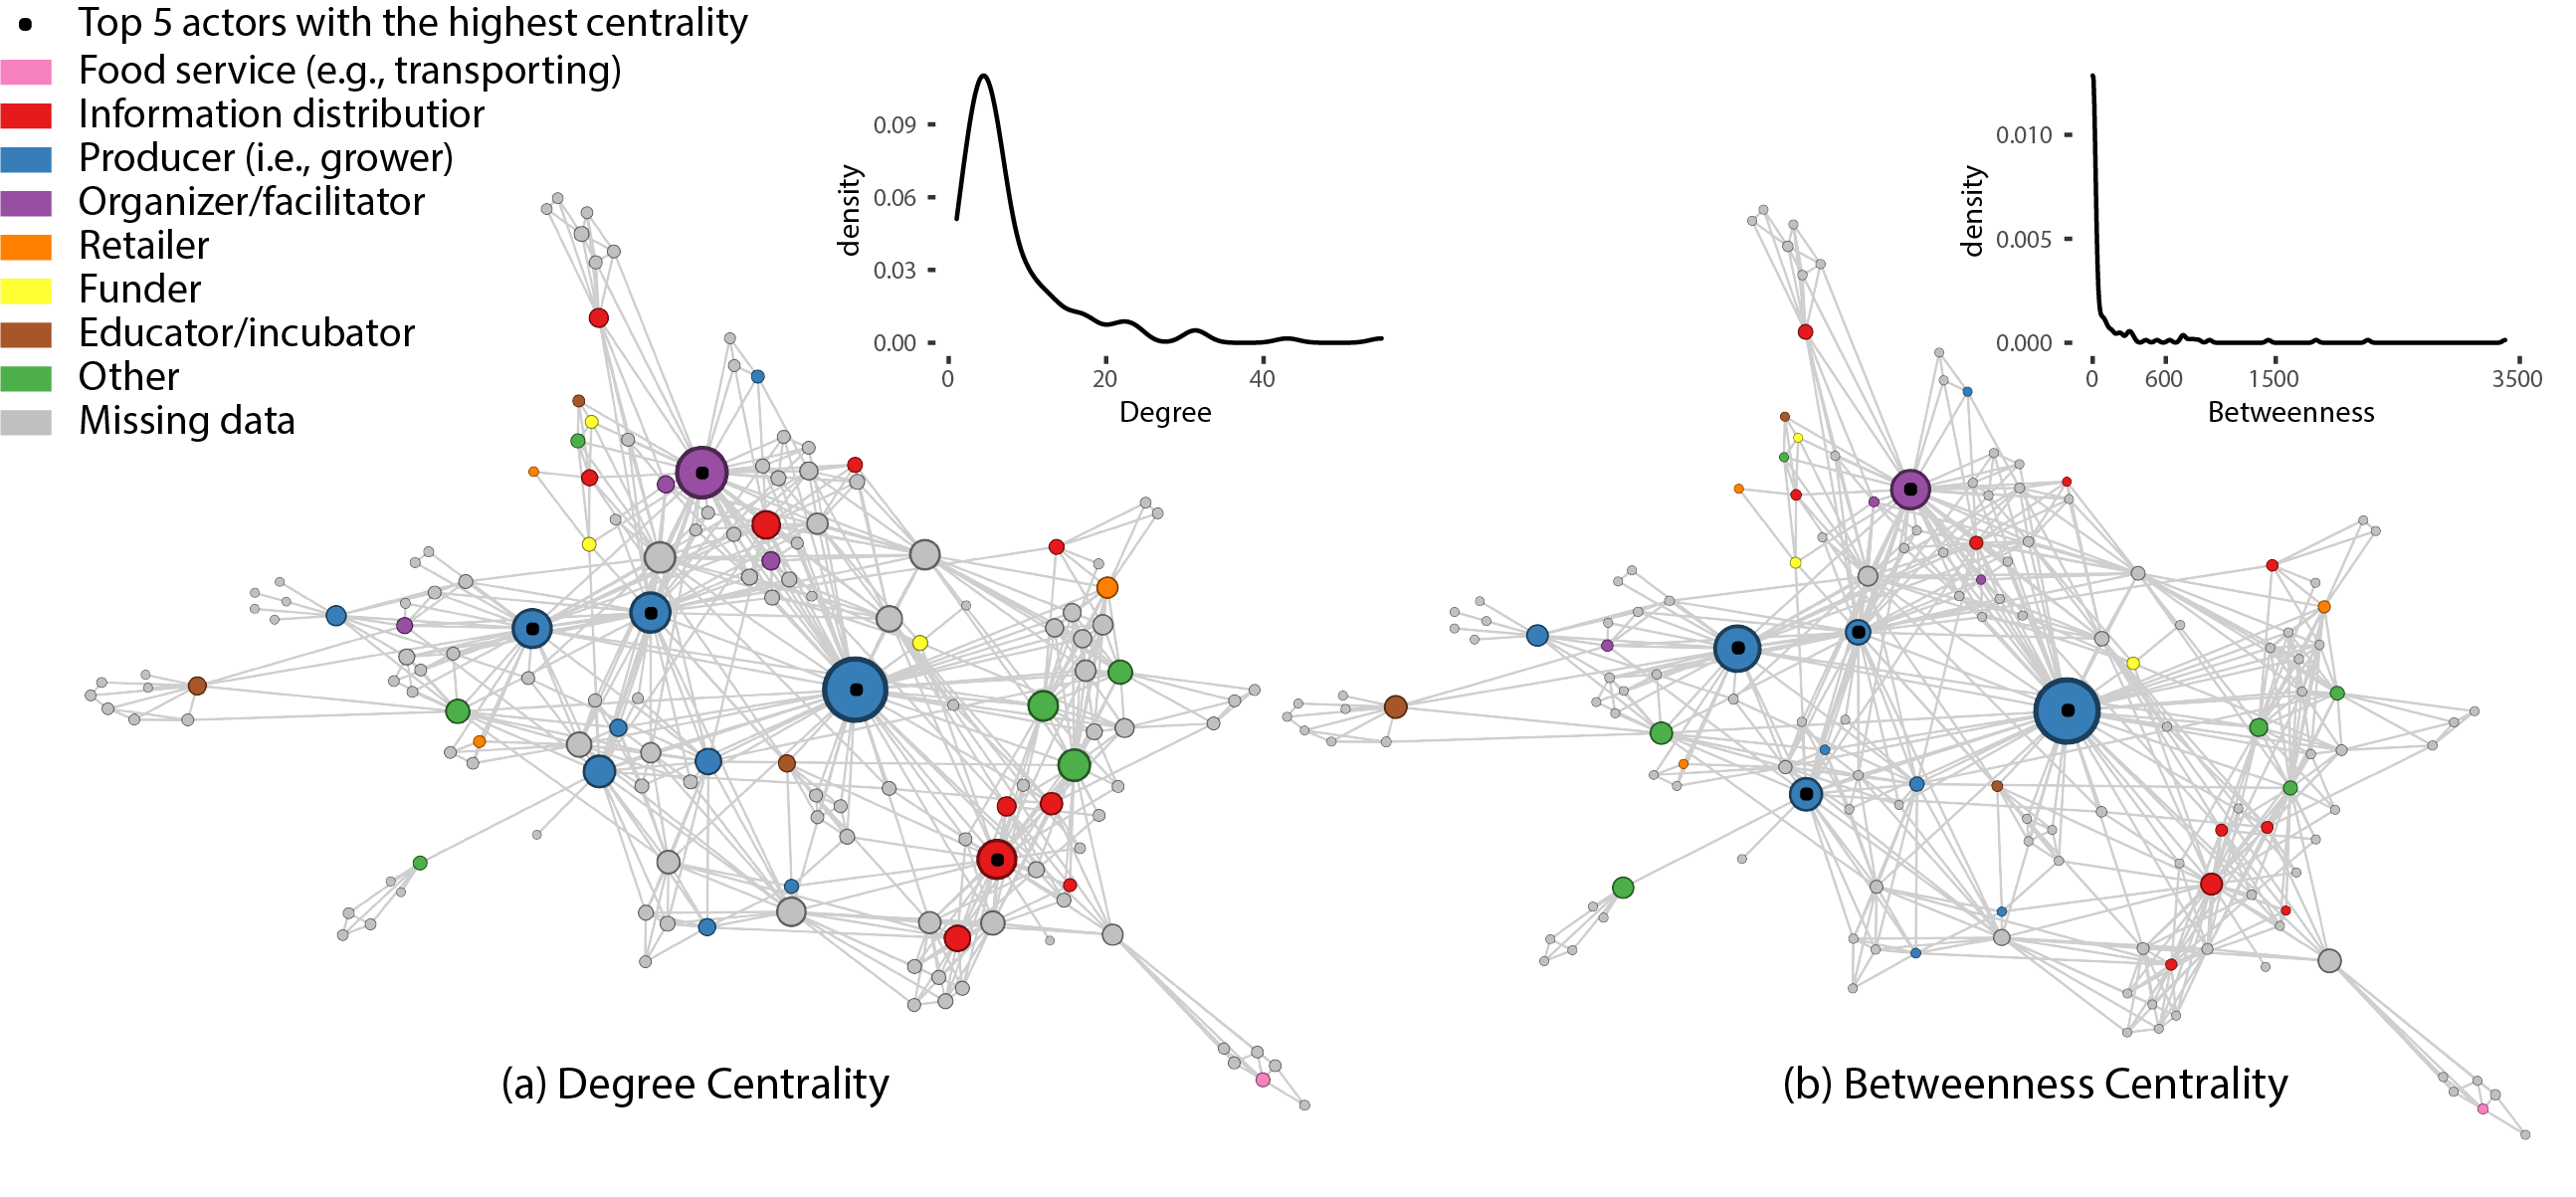
Working with different stakeholders and local communities in Buffalo, we (Emmanuel Frimpong Boamah, Zachary Korosh, Samina Raja, Yeeli Mui, Martha Bohm, Allison DeHonney, Rebekah Williams, Carol Ramos-Gerena and myself) make visible the social network infrastructure of people sustaining the urban food system in the post-industrial city of Buffalo, NY.
Abstract:
This article makes visible the social network infrastructure of people sustaining the urban food system in the post-industrial city of Buffalo, NY. It does so by probing how networks are launched and sustained over time, who is responsible for the networks, and to what end. The authors employ a survey to collect data on social networks among actors within the city’s food system. The findings suggest that Buffalo’s urban food system is a constellation of close-knit networks comprised primarily of local grassroots organizations having ‘small world’ effects— that is, short chains of actors within the network link all actors. These central actors rely on their high levels of trust and shared beliefs and vision to socially reproduce, sustain, and strengthen their urban food system through advocacy and information sharing. In sum, we find that Buffalo’s food system story is one of local self-reliance, co-production, and co-dependency among urban growers and other grassroots actors whose day-to-day practices and lived experiences are largely excluded from the municipal government’s policies and decisions.
Full References:
Frimpong Boamah, E., Yin, F., Korosh, Z., Raja, S., Mui, Y., Bohm, M., DeHonney, A., Williams, R., & Ramos-Gerena, C. (2024). Mapping the invisible: Bridging and trusting networks in sustaining the urban food system. Cities, 146, 104750. Available at https://doi.org/10.1016/j.cities.2023.104750 (pdf)


